k6 performance testing
test lifecycle
// 1. init code [REQUIRED]
// prepares the script, loading files, importing
// modules, and defining the test lifecycle functions.
//
// NOTE:
// All code that is outside of a lifecycle function is
// code in the init context

export function setup() {
  // 2. setup code [OPTIONAL]
  // setting up the test environment and generating data.
  // Whatever is returned from this function, is accessible
  // in default and teardown via `data` object.
}

export default function (data) {
  // 3. VU code (aka scenario function) [REQUIRED]
  // running for as long and as many times as
  // the `options` define.
}

export function teardown(data) {
  // 4. teardown code [OPTIONAL]
  // postprocessing data and closing the test environment.
}
Still wanna do
How to make k6 answer me these questions (probably with JSON output + jq):
- When this error started to occur, how many requests were sent in the last second?
- When the response time were bigger than X seconds, how many requests were sent in the last second?
idea - .csv logs can be read in metabase
- k6 doc about CSV: https://k6.io/docs/results-output/real-time/csv/
- metabase loading CSV: https://www.metabase.com/product/csv-uploads
k6 run --out csv=test_results.csv script.js
learning k6
- k6 Performance Testing - udemy - Very good at showing the basics of k6 and load/performance testing in general.
- hands-on way of learning: https://k6.io/docs/examples/tutorials/get-started-with-k6/
useful links
- https://k6.io/blog/learning-js-through-load-testing/
- Ways to visualize k6 results: https://k6.io/blog/ways-to-visualize-k6-results/
- Fine Tuning your OS for load testing
Test Types
- Load Testing
- Smoke
- Load (for performance)
- Stress
- Spike
- Breakpoint
- Soak/Endurance
k6 code
simple example
script.js:
import http from 'k6/http';
import { sleep } from 'k6';

// this acts like the main()
export default function() {
  http.get('https://test.k6.io')
  sleep(1);
}
running it:
k6 run script.js
increasing the virtual users (vus)
vus = Virtual Users
You can run like this:
# running with 10 virtual users, for 30 seconds
k6 run --vus 10 --duration 30s script.js
Instead of defining the VUs and the duration when calling the k6 CLI, we can define it in the code:
import http from 'k6/http';
import { sleep } from 'k6';

export const options = {
  vus: 10,
  duration: '30s'
}

export default function() {
  http.get('https://test.k6.io');
  sleep(1);
}
ramping up / ramping down
import http from 'k6/http';
import { check, sleep } from 'k6';

export const options = {
  stages: [
    // go to 20 VUs in 3 seconds
    { duration: '3s', target: 20 },

    // then go to 10 VUs in the next 13 seconds
    { duration: '13s', target: 10 },

    // finally go to 0 VUs in 2 seconds
    { duration: '2s', target: 0 },
  ],
};

export default function() {
  http.get('https://test.k6.io');
  sleep(1);
}
checking (it's like asserting)
HTTP Status Code
import http from 'k6/http';
import { check, sleep } from 'k6';

export const options = {
  stages: [
    { duration: '3s', target: 20 },
    { duration: '13s', target: 10 },
    { duration: '2s', target: 0 },
  ],
};

export default function () {
  // validating the response's status code
  const res = http.get('https://httpbin.test.k6.io/');
  check(res, {
    'status 200': (r) => r.status == 200
  });
  sleep(1);
}
Text in response body
import { check } from 'k6';
import http from 'k6/http';

export default function () {
  const res = http.get('http://test.k6.io/');
  check(res, {
    'verify homepage text': (r) =>
      r.body.includes(
        'Collection of simple web-pages suitable for load testing'
      ),
  });
}
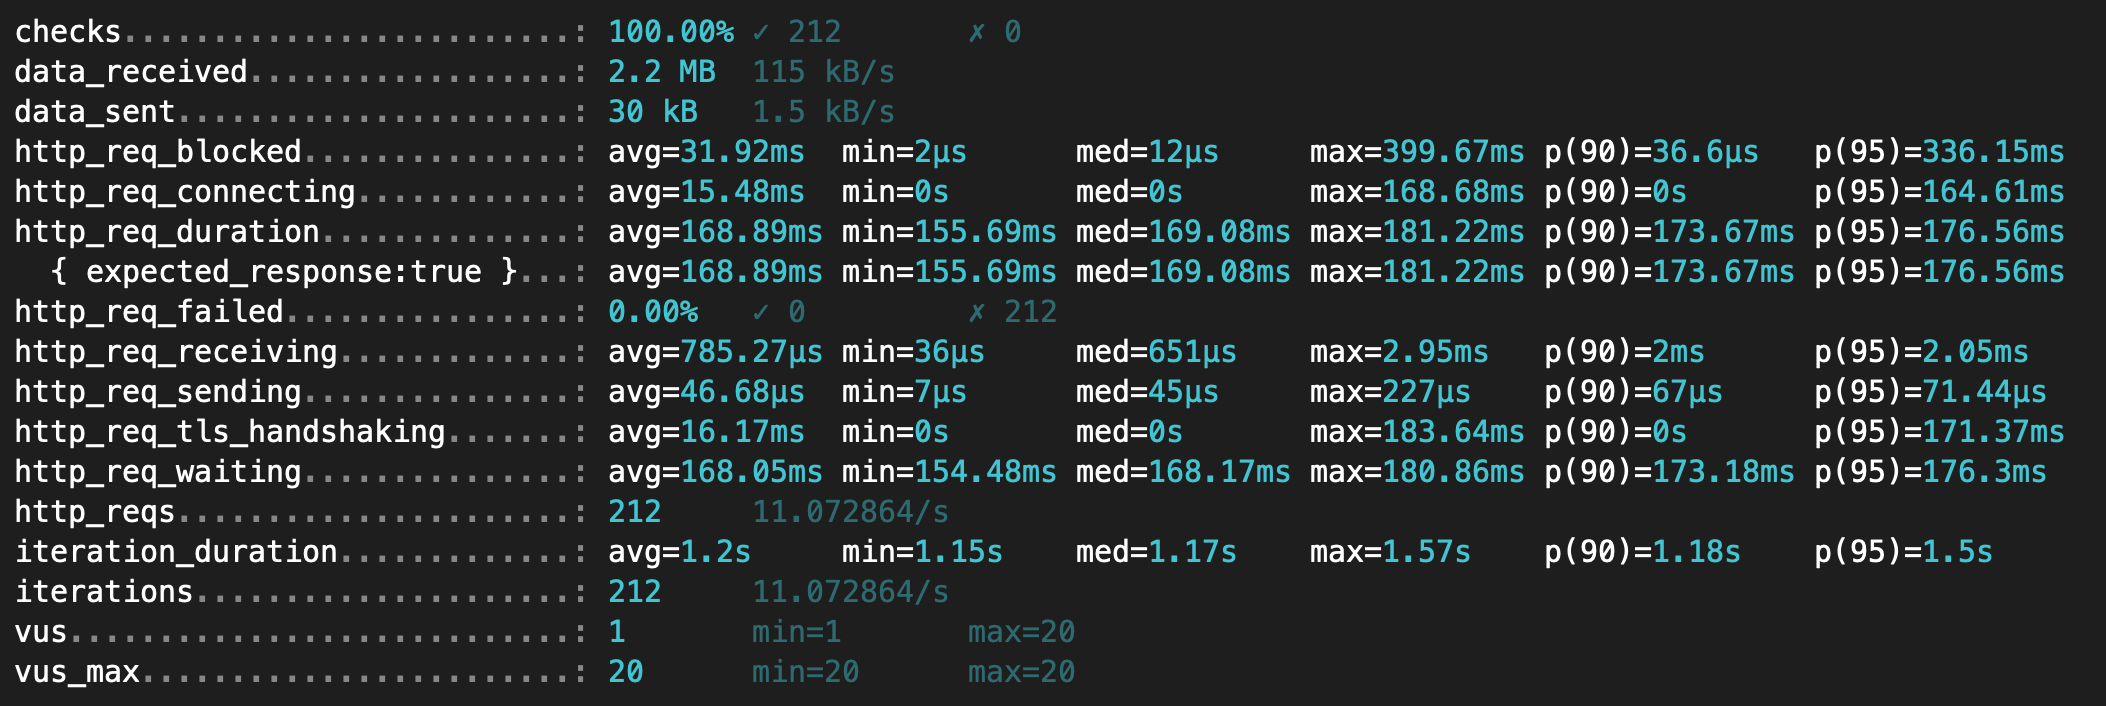
analyzing the output
avg != medavg: calculated averagemed: actual medium result
p(90): 90% percentilep(95): 95% percentile
example:

- avg = average (calculated)
- min
- med = actual medium number
- max
- p(90) = percentile 90%
- p(95) = percentile 95%
Example:
Non functional requirement: 90% of users must have a response in at most 4 seconds.
After the tests we got these times (10 numbers): 1, 4, 4, 2, 1, 7, 8, 1, 2, 3.
Sorting the results: 1, 1, 1, 2, 2, 3, 4, 4, 7, 8
We can see only 80% of users got a a response in at most 4 seconds (20% got a response in 7 seconds or more), therefore this test shows that the system doesn't match the requirement.
Note that if we were using another metric, like the average, we could have a misinformation, as the average is 3.3 (which is less than 4 seconds) but 20% of the users had a response in more than 4 seconds.
Thresholds
Threshold are a pass/fail criteria used to specify the performance expectations of the system under test.
Examples:
- system doesn't produce more than 1% errors
- response time for 95% of requests should be below 200ms
- response time for 99% of requests should be below 400ms
- specific endpoint must always respond within 300ms
code
// ...
export const options = {
  thresholds: {
    // - system doesn't produce more than 1% errors
    http_req_failed: ['rate < 1'],

    // - response time for 95% of requests should be below 200ms
    http_req_duration: ['p(95) < 200'],

    // - response time for 99% of requests should be below 400ms
    http_req_duration: ['p(95) < 400']

    // - specific endpoint must always respond within 300ms
    // ???
  }
}
Metric Types and Aggregation Methods
Metrics fall into four broad types:
- Counter: sum values
- example:
http_reqs
- example:
- Gauges: track the smallest, largest, and latest values
- example:
vus
- example:
- Trends: calculates statistics for multiple values (like mean, mode or percentile)
- example:
http_req_durationand most of thehttp_req_*
- example:
- Rates: track how frequently a non-zero value occurs
- example:
http_req_failed
- example:
Test Life Cycle
// 1. init code

export function setup() {
  // 2. setup code
}

export default function(data) {
  // 3. VU code
}

export function teardown(data) {
  // 4. teardown code
}
bizu
dial i/o timeout = computador não está aguentando abrir novas conexões
aumentar ulimit / range de portas